How to decode the black box of deep learning models

Data-driven models have proven effective in the metals industry, but their lack of explainability is a challenge. Further exploration is required if we want to decode this black box. As a leader in machine learning, SMS digital has implemented multiple AI projects that combine data-driven and physical models, as well as multi-input and multi-output models, to integrate time series, relational, and text data.
Enhancing interpretability in AI algorithms
There are three models in a steel plant: theory-based, empirical and heuristic, and data-driven. Theory-based models are based on physical, chemical, and metallurgical laws and can be easily understood. Empirical and heuristic models capture the knowledge and experience of experts in rules and can accumulate experience in operating the equipment. Data-driven models use past operational know-how to learn optimal operation paradigms. Although they may be more complex to comprehend, they deliver more accurate results than models based on experience. For example, calculating the ideal boil time for an egg is challenging due to the complexity of non-deterministic models based on both theory and empirical data. Uncertainty in measurements, the interplay of multiple factors, and high-dimensional problems can lead to undesired results.
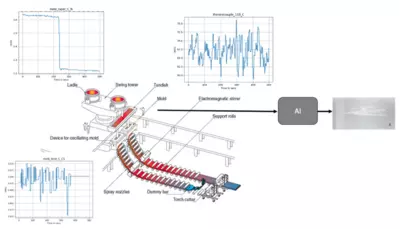
In continuous casting, clogging and the resultant flush-out of material, shown in sudden drops of the stopper rod, can cause sliver defects. Since experience-based models can detect these fluctuations but are challenging to adapt, it is necessary to convert the process into a data-driven model. We arranged a time series classification model that predicts sliver defects using signals such as the steel grade, chemistry, ladle treatment information, and stopper rod position. The AI selects the best deep-learning model and detects sliver occurrence through the input it receives from all the signals. AI algorithms can be complicated for operators to understand due to their complex and obscure nature, with at least half a million parameters and over 72 signals. The goal is to increase interpretability and build confidence by analyzing explainable parts of the AI.

Explaining predictions of time series classifiers
Time series classifier predictions can be partially explained by altering inputs and observing outputs of complex models. In a time series analysis, we calculated the average value within a given window and replaced random segments with the mean value. By doing this repeatedly, it is possible to determine which segments are most relevant for the prediction. It is essential to input realistic values that stay within the original sample.
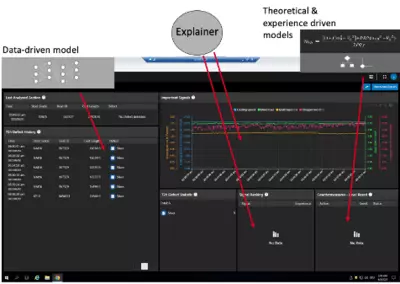
In the sliver defect model, we identified a set of parameters that effectively reduce the risk of sliver defects caused by stopper rod fluctuations. The time series model showed that green signals indicate a lower risk of defects, while red signals indicate a higher risk. It transpired that the stopper rod signal is significant, with fluctuations marked in red. By analyzing the signal ranking, we could predict the likelihood of sliver defects and generate an order of signals for each defect prediction.
In our final application, we can combine data-driven defect prediction models with signal rankings obtained from the model explainer. By filtering hundreds of signals, we can present the top five that are relevant for the defect prediction to the operator. The signal ranking can also activate countermeasures based on either theoretical or empirical evidence.

Our research demonstrated the ability to analyze explainable AI aspects and, by interpreting time-series predictions, improve our understanding. Combining data models and signal rankings helps predict defects, allowing operators to take informed action. Prescribing the set point with the highest gain for the next casting can optimize the application's potential in the future by reducing defects without affecting ongoing production.